UPDATE: This 2007 Article predated our current drive to AI (Artificial Intelligence) and reliance on Big Data or BI (Business Intelligence) but caught the trend as it emerged and has served as the basic theory behind the monetization of data – or how exactly do we Profit From ERP. Granted, ERP software helps cut transactional costs and drive efficiencies and productivities, but often, the real value lies in how our examination of better data gathering results in better management insights, leading to revenue generating activities for our clients. This theory and line of thought was the beginning of our transition from ROI (Return On Investment) Value Propositions showing the cost savings of ERP to the Cost/Revenue Model which sought to gather both cost savings and potential for revenue enhancement via the application of ERP. We also used the concept as the impetus to define and rank ERP requirements by the value to be expected of the project. That is, while it’s nice that Purchase Requisitions can be processed online, saving 30 minutes for all persons involved per Req, the fact that we can cut a $20m inventory down to $6m represents the savings of the current interest rate x $14m – so Demand Planning takes preference over Purchase Requisition processing when evaluating software.
Baseball is a notoriously statistics driven industry – yet Oakland realized most traditional baseball stats were designed measure potential to be great – as in Runs Batted In (RBI’s), while other, less common metrics like On-Base Percentage (OBP) and Slugging Percentage (SB) measured actual player performance. While other teams spent heavily on established stars with great RBI numbers, Oakland acquired up and coming minor league SB and OBP leaders – and revolutionized baseball in the process. Other teams followed, the Boston Red Sox, after years of hiring the best free-agents available (which all teams try to accomplish) finally hired the best analytical talent. The New England Patriots bring a strong analytical approach to a record four Super Bowl appearances in the NFL.
And how does this relate to your business?
You basically need only three things to compete with analytics – accurate measurement statistics, quantitative analysis and fact-based management.
Or more simply put, 1) data access, 2) reporting and 3) analytics.
In a small business, the owner or Primary Manager can be handle all three tasks: 1) He’s a front line source of data – merely observing the business as it happens, 2) Reporting – either by compiling what he’s seen because he has first hand knowledge of business process, observed time and time again, and 3) Analytics – analyzing and determining better ways of operating.
As businesses grow, homegrown solutions such as reports and spreadsheets allow various managers to replicate what the Primary Manager accomplished. The fault of this model is it’s inability to scale. Growth of departments and specialization means different managers are compartmentalized, with different measurements, varied goals and over time, the dreaded information silos are created – where purchasing has different reports than sales, and manufacturing doesn’t know what inventory has – and if anyone wanted to do some real analysis on the numbers, the first question is, who’s numbers and the second question is how do we know those particular datasets are correct?
In a larger business, ERP (Enterprise Resource Planning) and BI (Business Intelligence) serve these functions. ERP deploys information gathering to multiple departments and eliminates information silos. For example, if manufacturing records completion of 25 pallets of finished goods, the warehouse manager has to record 25 pallets being transferred into inventory – if there’s a discrepancy, it’s noticed immediately and corrected at the source. Information silos are destroyed. The company operates a single set of metrics. And what’s more, we can now see the effect of interdepartmental decision making – sure we can eliminate stock outs by over-ordering inventory, only now, we’ll see the cost increase in finance immediately – instead of waiting for accounting data some weeks and months down the line.
BI or Business Intelligence
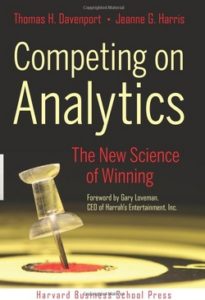
There’s a Harvard Business School Press book called Competing on Analytics, by Thomas Davenport and Jeanne Harris that studies how companies create sustainable competitive advantages by crunching numbers – not suprisingly, they find that 65% of the high performing companies have real-time analytical capabilities – and actually rely on that data for decision support.
Pricing, customer support, logistics, manufacturing – all can be improved with the application of real time data. In some companies, for example, Netflix, the customers who rent the fewest movies earn the quickest mail replacement service – why? With flat fee pricing, the customer who spends $25 a month to keep 5 movies at home and only watches 3 a month is far more profitable than the customer who pays the same $25 fee, but watches 5 movies every weekend for a total of 20 a month. Counter-intuitive, but quickly apparent when looking at the analytics.
In our practice, food manufacturers face a difficult task. Food costs (raw materials) fluctuate on everything from the pork bellies futures market to the costs of corn escalating due to ethanol production. Then transportation costs factor delivery sizes, distances, frequencies of delivery, not to mention skyrocketing fuel pricing. Food distribution involves brokers, broker agents, commissions, shelf allotment fees. There’s spoilage and shelf-life issues, then charge-offs and returns.
Given this complexity, most food manufacturers know that they make money at the end of the month – but that often means losing money on 5-10% of the contracts or customers they serve, and sometimes losing money on certain products they manufacture.
With established ERP customers, we often set up demos of third party Business Intelligence modules (EPM – for Enterprise Performance Management) by loading the software the night before the demo, extracting data from the ERP and populating the BI data warehouse with live information. A couple of years back, we opened a demo at a midwest food manufacturing company by bringing on screen a dashboard showing their most profitable customers, their most profitable products. It seemed to be going well until the CEO rose and asked us to stop, and please leave the room for a few minutes. We were quickly ushered out while the management team examined the data, realized three production runs that were scheduled to be produced that week would lose money on a customer who’s return rates were legendarily high and was one of those problem customers dreaded by everyone in the company. As soon as the shop floor schedule was changed, with those particular runs cancelled, we were allowed to return and complete the demo.
But what we find, more often than not – once we can accurately capture cost down to the individual unit with ERP, is that using BI we will identify 5-10% of a company’s production that, if not actually money losing, falls far below established revenue targets. For a growing company to realize they can outsource these problem clients to their competitors (by firing the customer) and then realize without spending another dime on equipment, labor, or raw materials, the can have another 5-10% of plant capacity overnight – the impact can be huge.
Try it – take your annual revenue derived from manufacturing X 5% – and realize that’s the number you can add to your bottom line without adding labor, materials or equipment. Makes BI look pretty attractive.
For more information on how to eliminate excess inventory via Demand Planning and how to pinpoint cost accounting to the individual each, job, product or run level, reach us at Info@ProfitFromERP.com or reach out to Gene Hammons, MBA directly at gh@genehammons.com